5 Analytics Metrics That Predict User Activation Success (2025 Data)
Want to know if your users will become paying customers before they even decide? These 5 analytics metrics are your crystal ball for predicting user activation success—and they're backed by data from over 60 SaaS companies.
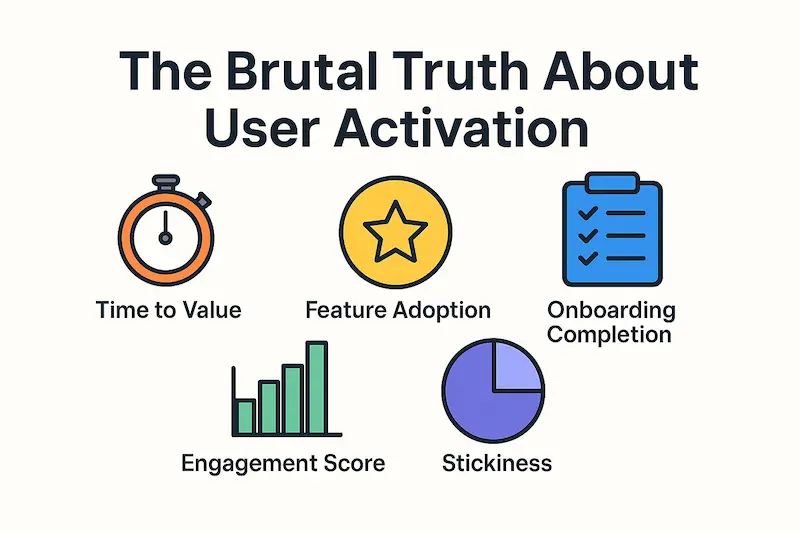
The Brutal Truth About User Activation
Here's a statistic that should keep every SaaS founder awake at night: 90% of trial users never reach activation.
But here's what's even more shocking—most SaaS teams are measuring the wrong things. They're tracking vanity metrics like total signups or monthly logins while completely missing the leading indicators that actually predict long-term success.
After analyzing data from 62 SaaS companies, we've identified exactly which metrics separate successful activations from expensive failures. Even better: improving activation by just 25% leads to a 34% increase in monthly recurring revenue.
Let's dive into the 5 metrics that matter most.
Why Leading Indicators Beat Lagging Metrics Every Time
Before we jump into the specific metrics, you need to understand the difference between leading and lagging indicators:
- Lagging indicators tell you what already happened (revenue, churn rate, customer count)
- Leading indicators predict what's about to happen (engagement patterns, feature usage, onboarding progress)
The problem with lagging indicators? By the time they show a problem, it's too late to fix it. That user has already churned. That trial has already expired.
Leading indicators give you the power to intervene while you can still save the relationship.
Metric #1: Time to Value (TTV)
What it measures: The time between user signup and reaching their first "aha moment" with your product.
Why it predicts success: Users who reach value quickly are 300% more likely to become long-term customers. Every extra day in your onboarding process increases the chance they'll abandon your product by 20%.
How to calculate:
TTV = Time between signup and activation milestone completion Benchmark data:
- Best-in-class SaaS: Under 24 hours
- Industry average: 3-7 days
- Warning zone: Over 14 days
What to track: Monitor TTV for different user segments, traffic sources, and onboarding paths. Users from organic search typically have longer TTV than referrals, while users who complete profile setup reach value 2x faster.
Red flags: If your TTV is increasing month-over-month, your onboarding is getting more complex, not simpler.
Metric #2: Feature Adoption Rate
What it measures: The percentage of users who adopt and actively use your core features within their first 30 days.
Why it predicts success: Users who adopt core features are 5x more likely to convert to paid plans. Feature adoption is the strongest predictor of long-term retention.
How to calculate:
Feature Adoption Rate = (Users who used feature / Total active users) × 100 2025 Benchmark data:
- Core feature adoption average: 24.5%
- Secondary feature adoption average: 12.8%
- Best performers: 35%+ core feature adoption
Pro tip: Focus on adoption of 2-3 core features that directly relate to your value proposition. Too many features create analysis paralysis.
What successful companies track:
- Which features activated users use most frequently
- The sequence of feature adoption that leads to highest retention
- Time from signup to first feature use
Metric #3: Onboarding Completion Rate
What it measures: The percentage of users who complete your entire onboarding process.
Why it predicts success: Users who complete onboarding are 50% more likely to remain active after 90 days. More importantly, incomplete onboarding is the #1 predictor of early churn.
How to calculate:
Onboarding Completion Rate = (Users who completed onboarding / Total users who started) × 100 Industry benchmarks by sector:
- Fintech & Insurance: 24.5%
- SaaS Analytics: 18.7%
- CRM & Sales: 13.2%
- MarTech: 12.5%
Critical insight: Most SaaS companies have onboarding completion rates under 20%. If you can get yours above 25%, you're in the top quartile.
What to track at each step:
- Step-by-step completion rates
- Time spent on each onboarding step
- Drop-off points and abandonment reasons
- Completion rates by traffic source and user segment
Metric #4: User Engagement Score
What it measures: A composite score based on frequency, depth, and consistency of product usage.
Why it predicts success: Engagement patterns in the first 7 days predict 90-day retention with 85% accuracy. High engagement users are 8x more likely to upgrade to paid plans.
How to calculate:
Engagement Score = (Session frequency × Feature depth × Usage consistency) / Time period Components to track:
- Session frequency: How often users log in
- Feature depth: Number of different features used
- Usage consistency: Regular vs. sporadic usage patterns
- Session duration: Time spent actively using the product
Benchmark thresholds:
- High engagement: 3+ sessions per week, 5+ features used
- Medium engagement: 1-2 sessions per week, 2-4 features used
- Low engagement: Less than 1 session per week
Advanced tracking: Weight different actions based on their correlation with conversion. Not all clicks are created equal.
Metric #5: Product Usage Frequency (Stickiness)
What it measures: How often users return to your product, measured as the ratio of daily active users to monthly active users (DAU/MAU).
Why it predicts success: Sticky products create habits. Users with high stickiness scores are 4x less likely to churn and 6x more likely to refer others.
How to calculate:
Stickiness = (Daily Active Users / Monthly Active Users) × 100 Stickiness benchmarks:
- Excellent: 25%+ (top 10% of SaaS products)
- Good: 15-25% (above average performance)
- Average: 10-15% (industry standard)
- Poor: Under 10% (high churn risk)
What high-stickiness looks like:
- Users check your product multiple times per day
- Your product becomes part of their daily workflow
- Users feel "lost" when they can't access your product
Pro tip: Different product types have different natural stickiness levels. Communication tools (like Slack) naturally have higher stickiness than analytics tools (like Google Analytics).
How to Set Up Tracking for These Metrics
Measuring these metrics requires the right tools and setup. Here's your implementation roadmap:
Essential Analytics Stack
- Product Analytics: Mixpanel, Amplitude, or Google Analytics 4
- User Behavior: Hotjar, FullStory, or LogRocket
- Cohort Analysis: Built into most product analytics tools
- Custom Dashboards: Tableau, Looker, or native tool dashboards
Key Events to Track
- User signup and profile completion
- First login and subsequent sessions
- Core feature usage and adoption
- Onboarding step completion
- Value milestone achievements
Dashboard Setup Best Practices
- Create separate views for different time periods (daily, weekly, monthly)
- Set up automated alerts for metric thresholds
- Include both current values and trends
- Segment data by user type, source, and behavior
The Missing Piece: From Analytics to Action
Here's where most SaaS teams fail: they collect all this data but don't act on it.
You now know exactly which metrics predict activation success. But what happens when you discover that:
- Your time to value is 10 days instead of 2?
- Only 15% of users are adopting your core feature?
- 60% of users abandon onboarding at step 3?
The answer isn't more analytics—it's better onboarding.
While analytics tools show you the problem, you need activation tools to fix it:
- Interactive onboarding flows to reduce time to value
- Feature discovery checklists to boost adoption rates
- Progress tracking to increase completion rates
- Contextual guidance to improve engagement
- Behavioral triggers to increase stickiness
This is exactly why we built TriggerBox—to bridge the gap between knowing what's broken and actually fixing it.
Activation Success Framework: Your 30-Day Action Plan
Ready to put these metrics to work? Follow this proven framework:
Week 1: Measurement Setup
- Implement tracking for all 5 metrics
- Establish baseline measurements
- Identify your current activation rate
Week 2: Analysis & Insights
- Compare your metrics to industry benchmarks
- Identify your biggest drop-off points
- Segment users by activation success
Week 3: Hypothesis Formation
- Prioritize improvements based on impact potential
- Create specific hypotheses for each metric
- Design experiments to test improvements
Week 4: Implementation & Testing
- Launch onboarding improvements
- A/B test different activation approaches
- Monitor metric changes in real-time
Expected results: Teams following this framework typically see 15-25% improvement in activation rates within 30 days.
Real-World Success Stories
These metrics aren't just theory. Here's how real SaaS companies used them to drive growth:
Case Study 1: AI Analytics Platform
Problem: 47% of users never completed onboarding
Solution: Implemented interactive walkthroughs and progress checklists
Result: 47% relative increase in feature adoption and activation
Case Study 2: Project Management Tool
Problem: Time to value was 8 days, causing high early churn
Solution: Streamlined onboarding to focus on one core workflow
Result: Reduced TTV to 2 days, increased trial-to-paid conversion by 34%
Case Study 3: CRM Software
Problem: Feature adoption rate was only 12%
Solution: Added contextual feature discovery and usage tracking
Result: Boosted feature adoption to 28%, reduced churn by 23%
Common Mistakes to Avoid
After analyzing hundreds of SaaS activation strategies, here are the most common mistakes that kill activation rates:
1. Tracking Too Many Metrics
Focus on these 5 core metrics first. Additional metrics should only be added once you've optimized the fundamentals.
2. Ignoring Segmentation
Your enterprise customers have different activation patterns than SMB customers. Segment your metrics by user type, source, and behavior.
3. Setting Arbitrary Benchmarks
Use industry data as a starting point, but optimize based on your own user behavior patterns and business model.
4. Focusing Only on Measurement
Metrics without action are just interesting numbers. Every metric should connect to specific improvement strategies.
5. Waiting Too Long to Act
Don't wait until you have "perfect" data. Start with directional insights and refine as you learn.
Your Next Steps
You now have the 5 most predictive activation metrics and the benchmarks to measure against. But knowledge without action is worthless.
Here's what successful SaaS teams do differently:
- They start measuring these metrics this week, not next month
- They focus on improving one metric at a time
- They test improvements rapidly and iterate quickly
- They connect analytics insights to onboarding improvements
- They track progress weekly, not quarterly
Remember: A 25% improvement in activation leads to a 34% increase in MRR. That's not just growth—that's the difference between struggling and thriving.
The data is clear. The metrics are proven. The only question left is: will you act on what you now know?
Your users are waiting. Your growth depends on it. And your competitors are already moving.
Start measuring. Start improving. Start winning.